




You know your cost of goods to the penny. You know what freight added to the last container, what a Saturday delivery run costs, what the floor team earns on a written ticket. Then the advertising report arrives and the confidence leaves the room, because it is written in a language nobody in furniture retail was ever taught.
That gap costs money in both directions. Owners cut campaigns that were quietly profitable because a dashboard showed a number they did not like, and they keep campaigns that lose money because the number looked big and nobody asked what it counted. Return on ad spend, cost per acquisition and customer acquisition cost are arithmetic you can do on the back of an invoice, and once you can do it you stop taking anybody's word for whether your advertising works, including ours.
This is the furniture version: high ticket, known margin, a decision that takes weeks, and most of the money still written up in a showroom where no ad platform can see it.
The short answer
Return on ad spend is revenue divided by advertising spend. Cost per acquisition is advertising spend divided by the number of sales it produced. Customer acquisition cost adds everything else it took to win that sale: management fees, creative, software and your team's time. Your break even point comes from your own gross margin, not from an industry benchmark, and the moment you know it you can set a target cost per sale, work backwards to a target cost per lead, and judge every campaign against a number that belongs to your store rather than to somebody else's.
The six numbers, defined for furniture
Return on ad spend. Revenue you can attribute to advertising, divided by what you spent. Spend 4,000 dollars, match 20,000 dollars of delivered sales back to the campaigns, and every dollar returned five dollars of revenue. Revenue, not profit. That distinction is where most of the confusion lives, because five dollars of revenue at a 40 percent margin is two dollars of gross profit, and delivery, discounts and payroll still come out of it.
Cost per acquisition. Advertising spend divided by sales. A campaign that spent 5,600 dollars and produced twenty written tickets cost 280 dollars per sale. Count it on delivered sales rather than orders, because cancellations and backorders are not customers.
Customer acquisition cost. The honest version. Take the media spend, add the fees or salary that manage it, the photography and video, the landing page work and the software, then divide by new customers. It is always higher than the platform number and it is the figure your accountant recognizes.
Cost per lead. Spend divided by inquiries: form fills, calls of a real length, chats, financing applications, appointment requests. It is the earliest reliable number, which is why owners over react to it. A cheap lead that never buys is the most expensive thing in the account.
Cost per store visit. Google Ads reports store visit conversions for accounts with a linked, verified Google Business Profile and enough volume. It is modeled rather than counted, so read it as a trend line, not a receipt. For a showroom it is still the closest the platforms get to what you sell.
Contribution margin. What is left of the ticket after cost of goods, delivery, financing fees, returns and the discount that closed the sale. It is the pool your advertising spends from, and almost nobody computes it before setting a budget.
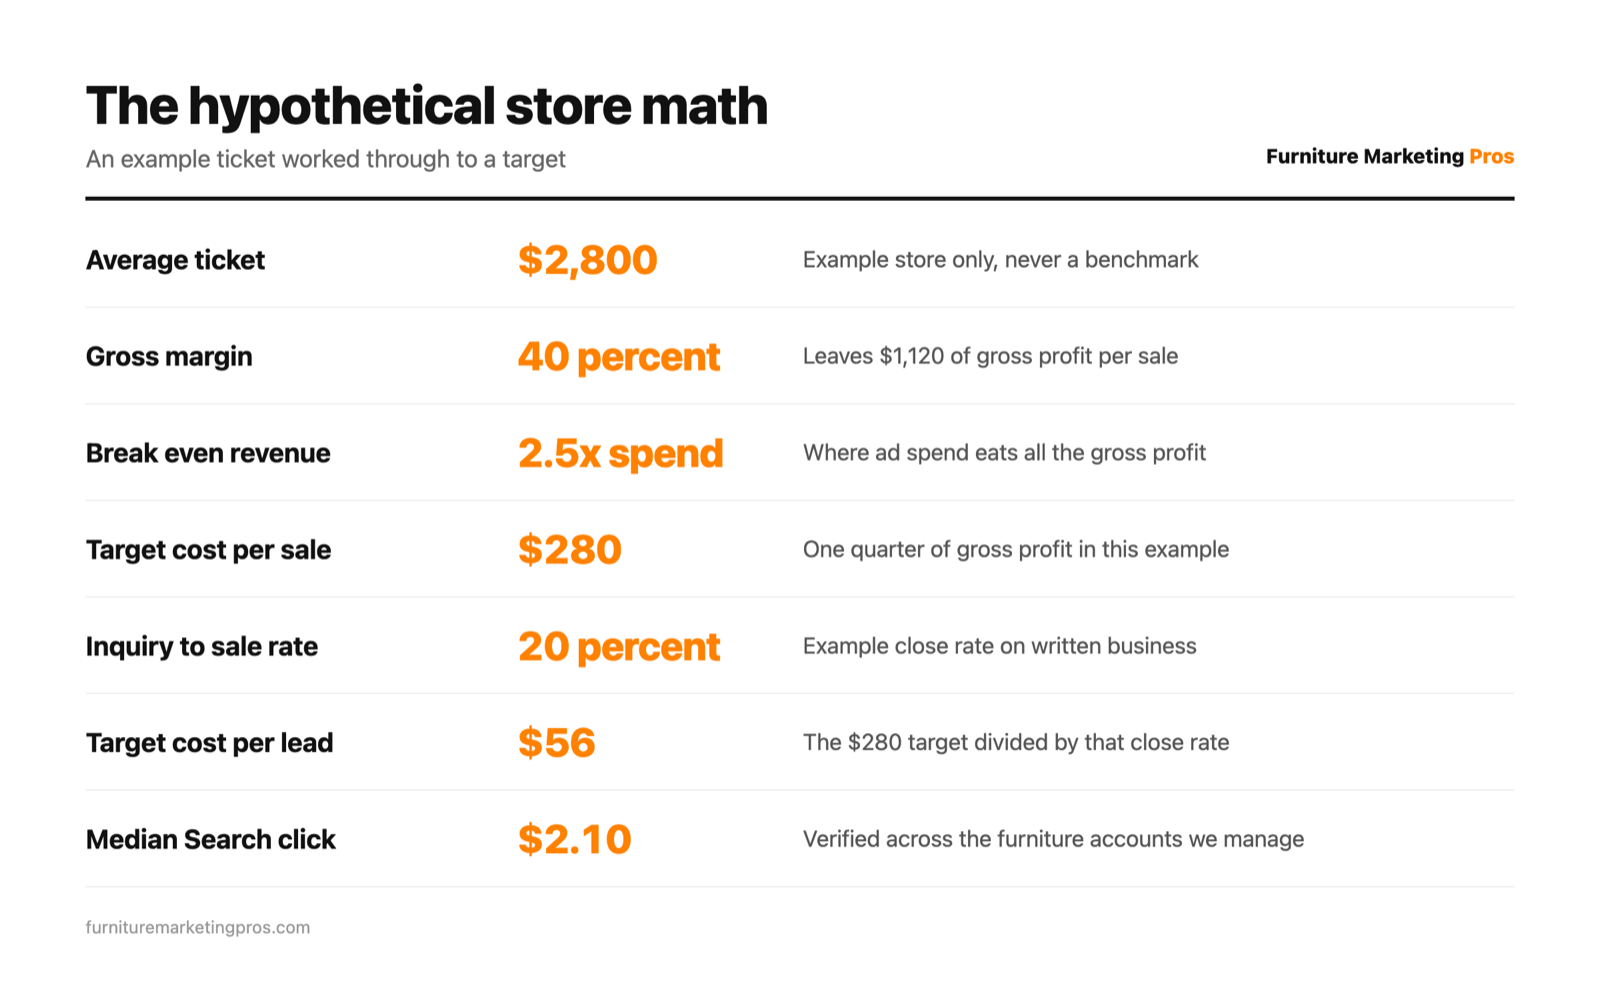
A worked example: one hypothetical store
Everything in this section is invented for the arithmetic. It is not a benchmark, not our results and not a client's. Put your own figures in the same slots.
The hypothetical store. Average delivered ticket of 2,800 dollars. Gross margin of 40 percent. That leaves 1,120 dollars of gross profit on the average sale.
Break even. Advertising breaks even when the gross profit it generates equals the money spent. At a 40 percent margin, revenue has to reach two and a half times the ad spend before you are even. At a 50 percent margin the bar falls to twice the spend, and at 30 percent it climbs past three times. Your margin sets it, not the platform.
A target you can live with. Break even is a floor, not a goal. Say this owner decides to invest a quarter of gross profit in winning the customer. A quarter of 1,120 dollars is 280 dollars, so the target cost per acquisition is 280 dollars and the rest stays in the business to cover overhead and profit.
Backwards to a cost per lead. Suppose one inquiry in five turns into a delivered sale. Five leads per sale at a 280 dollar target means the store can pay up to 56 dollars for a lead, and that is the number the person running the account manages to every week.
Backwards again to clicks. Across the furniture accounts we manage the median cost per click is 2.10 dollars on Search and 1.22 dollars on Performance Max. At 2.10 dollars, a 56 dollar lead target allows roughly twenty six clicks per inquiry. If the website turns one click in forty into an inquiry, the real cost per lead lands near 84 dollars and the store is over target. That is a website conversion problem wearing an advertising costume, and it is fixed on the page rather than in the bidding.
The three levers. When the math does not work, three things move it: the ticket, the margin, or the conversion rate between click, lead and delivered sale. Financing and attachment selling raise the ticket. Better photography, faster replies and a real appointment process raise the conversion rate. Bidding moves the smallest lever of the three.
Contribution margin is what you are really spending from
Gross margin is not what lands in the bank. In the hypothetical store above, take the 1,120 dollars of gross profit, then subtract delivery and setup, the fee the financing partner charges on a promotional plan, the tickets that come back damaged, and the discount that closed the deal. What survives is the pool advertising spends from.
Do this subtraction once a year with whoever keeps your books, then set your advertising target against the surviving number rather than the shelf margin. Two stores with identical sales can have very different room to spend. It is also the honest way to think about financing: a monthly payment in the ad is among the most reliable reasons a furniture ad gets a response, and its cost belongs in this calculation rather than in a footnote.
Why the platform's reported return is an estimate for a showroom
Google and Meta report what they can see. For an ecommerce brand that is nearly everything. For a furniture retailer with a showroom it is a fraction, and the fraction moves.
Three things distort it. Browser tracking lost a large share of its signal after Apple's App Tracking Transparency arrived in 2021, which is why the Conversions API and server side tagging now matter more than any bidding setting. Both platforms also model conversions they cannot observe, including view through conversions where nobody clicked. And the sale that matters most, written on a Saturday by a customer who saw a Reel three weeks earlier, appears in no platform report unless you put it there.
So platform numbers are a steering wheel, not a scoreboard. Use them to compare this week to last week inside one account. Use your own CRM to decide whether the advertising made money. Our guide to Meta ads for furniture stores covers the tracking setup that narrows the gap, and the Google Ads playbook covers the conversion actions worth counting in the first place.
Blended numbers, and the two ways they mislead
A blended figure divides all revenue by all advertising spend. It is a fair business level sanity check with two failure modes owners walk into constantly.
It hides the channels. Brand search and retargeting almost always look outstanding, because they harvest demand something else created. Cut the campaigns that created that demand and the flattering numbers collapse a quarter later. Our piece on retargeting for furniture stores explains why those audiences look so cheap.
It credits advertising with sales it did not make. Repeat customers, referrals, walk in traffic, organic search and the email list all land in the same revenue total. Separate new customer acquisition cost from blended acquisition cost and the picture changes fast, especially where email and SMS carry 20 to 30 percent of revenue.
Read both. The blended number says whether the business is working. The channel numbers say what to do on Monday.
What the season does to every one of these numbers
Demand is not flat in furniture, and neither is the price of reaching it. Across the furniture Google Ads accounts we manage, a February click cost about eight times an April click. November drew 2.3 times October's impressions and the cheapest clicks of the year. August was the largest impression month in the window we studied, on the run up to Labor Day.
So a cost per acquisition that doubles in February may be reporting the calendar rather than the campaign. Compare a month to the same month last year and a sale window to the equivalent window. Pace budgets to that calendar, raising two weeks before each window so the campaigns have data when demand lands. The furniture marketing budget guide works through how much to commit across the year.
What to track in the CRM, since the platforms cannot
Every number above depends on knowing which sales came from which source, and that record has to live somewhere you own.
- Source on every inquiry, captured automatically rather than remembered, plus a question at the counter for the sales the system missed.
- The whole ladder: inquiry, appointment booked, appointment kept, written, delivered. Stores that see only the ends cannot tell a traffic problem from a closing problem.
- Call tracking with a real duration threshold, because a fifteen second hang up is not a lead.
- Time to close, because furniture takes two to twelve weeks and a thirty day window makes a seventy day sale look like a loss.
- Cancellations and returns, subtracted, so acquisition cost is counted on delivered business.
A CRM built for furniture retail exists to hold exactly this, and without it every figure in this article is a guess with a dollar sign in front of it.
Setting targets you can actually manage to
Compute the break even multiple from your own gross margin. Decide what share of contribution margin you will invest in a new customer, and that is your target cost per acquisition. Divide by your inquiry to sale rate for a target cost per lead, then compare that to what clicks cost in your market to see whether the plan is possible at all. Review monthly, act quarterly, and intervene immediately only for the obvious failures: spend running with no inquiries, a tracking break, a disapproved feed. Owners who work this way stop arguing about advertising and start talking about margin.
Where this fits with the advertising itself
Setting the targets is the owner's job and it takes an afternoon. Hitting them week after week, across campaigns, seasons and a catalog that changes constantly, is the daily work of paid ads management, and it only works when everyone involved uses the same definition of a sale. If you want a second set of eyes on what your numbers really say, book a strategy call and bring your ticket, your margin and your close rate.
Key takeaways
- Return on ad spend measures revenue, not profit, and your gross margin sets the break even point.
- Cost per acquisition counts media only, customer acquisition cost counts everything, and the second number is the one your accountant recognizes.
- Work from ticket and margin to a target cost per sale, then backwards to a target cost per lead and an affordable click.
- Platform reported returns are estimates for a showroom business, so use them to steer campaigns and use your CRM to judge them.
- Blended figures flatter harvesting channels and credit advertising with referrals, repeat business and organic sales.
- Seasonal swings are large enough that month against month comparisons mislead, so compare like periods and count delivered sales over a window as long as your selling cycle.
Frequently asked questions
What is a good return on ad spend for a furniture store?
There is no universal figure, and anyone quoting one has not asked about your margin. Compute your break even multiple from your own gross margin, then set a target above it that leaves enough contribution margin to run the business. A store at 50 percent margin and one at 30 percent need different results from identical campaigns.
What is the difference between cost per acquisition and customer acquisition cost?
Cost per acquisition usually means media spend divided by sales, which is what the platform can calculate. Customer acquisition cost adds fees, creative production, software and staff time. Use the first to compare campaigns and the second to decide whether the whole program pays for itself.
How do I measure advertising that leads to showroom sales?
Capture the source on every inquiry in a CRM, track calls with a duration threshold, use Google store visit conversions as a trend where your Business Profile qualifies, and ask buyers at the counter what brought them in. None is perfect alone, and together they beat any single platform report.
Should I judge my advertising every month?
Review monthly, decide quarterly. Furniture purchases take two to twelve weeks, so a month of data is partly a report on the previous month's traffic. The only things worth reacting to immediately are broken tracking, disapproved products and spend with no inquiries at all.
My cost per lead is above target. Do I cut the budget?
Usually not first. Check the website conversion rate, the speed of your follow up and the quality of the offer before touching the budget, because those levers move the number further than bidding does. Cutting a campaign that is producing sales because the lead price looks high against a target set in another season is the most common expensive mistake here.